



DevOps Implementation Services: A Practical Buyer’s Guide
DevOps implementation services are a time-boxed engineering engagement that builds the path from code commit to production and leaves your engineers owning it. Scope covers an assessment, CI/CD pipelines, infrastructure as code, containers, observability, security gates, and the working agreements that keep the pipeline maintained after handover. The question that separates a useful proposal from a polished one is what you'll be able to show an auditor, a new hire, or an on-call engineer on the day the engagement ends.
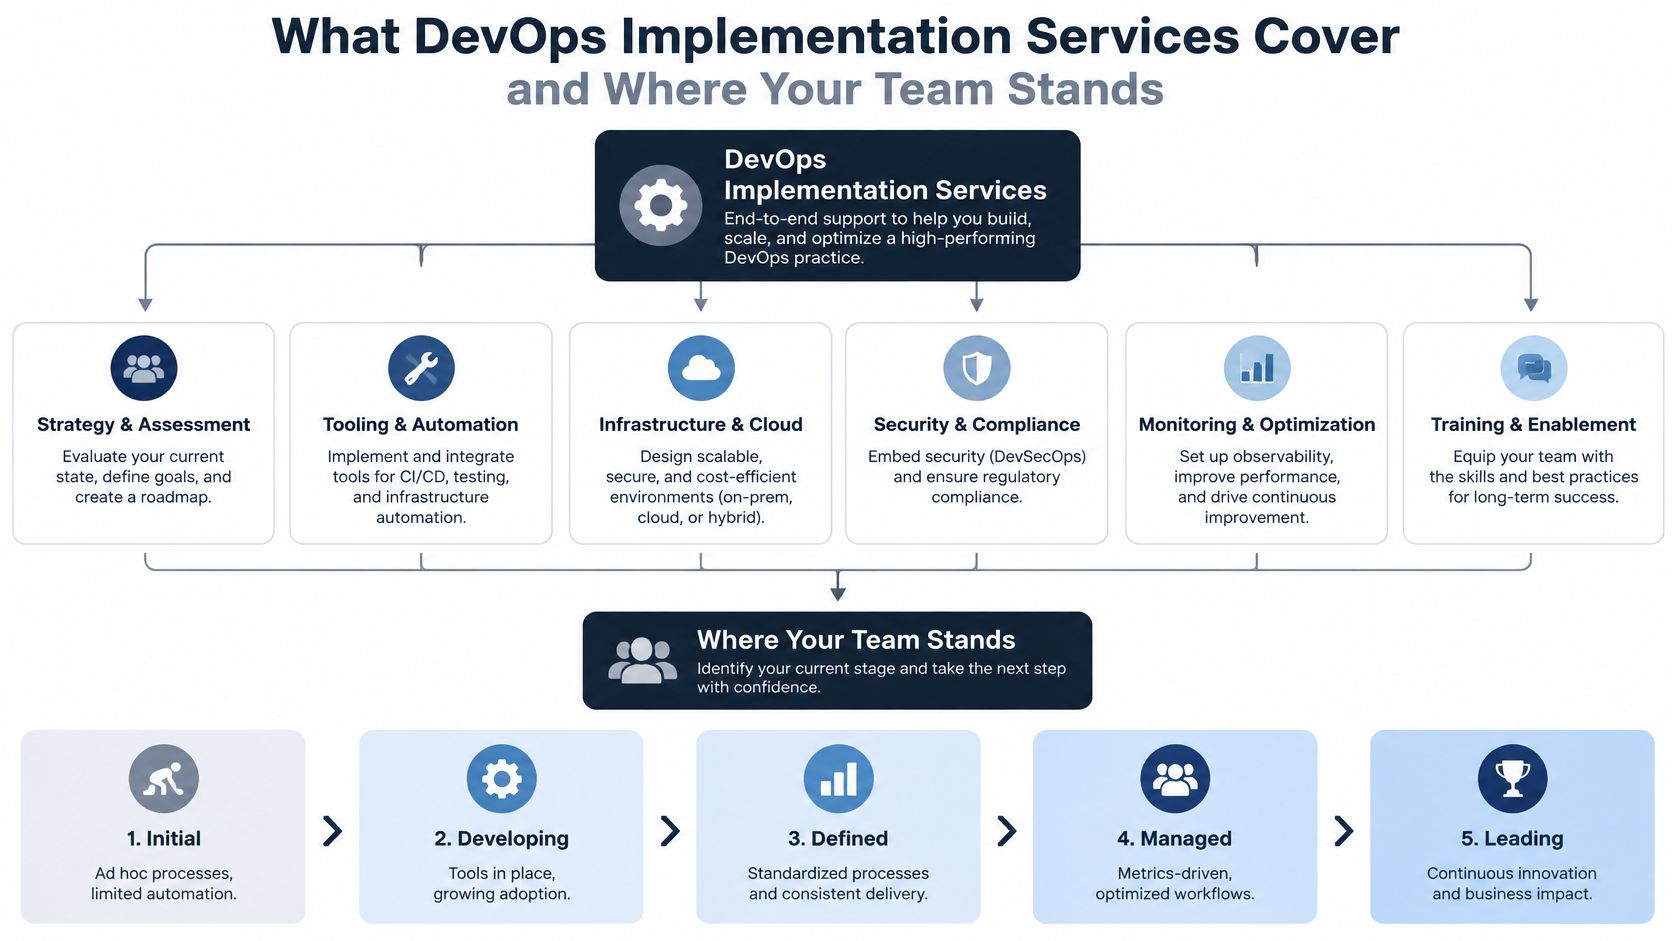
What DevOps Implementation Services Cover and Where Your Team Stands
What breaks between a code change and a production release? An implementation assessment should trace that path with the engineers who run it, reviewing deployment steps, recent incident records, and available CI history before recommending tools. Bridge Global's DevOps services improve builds, deployments, automation, monitoring and infrastructure so teams can release software more reliably.
The work usually spans five capabilities. For regulated teams, design compliance controls into the delivery pipeline from the first pilot: automation, audit evidence, and release accountability need to fit together.
-
CI/CD pipeline: Build, test, package, and deploy stages connect to version control, with pipeline definitions stored alongside the code. Retain run history and the definitions needed to explain how a release was built and promoted.
-
Infrastructure as code: Environment changes are declared in reviewable files. Keep the change history and the plan output associated with each infrastructure update.
-
Containers and orchestration: Build reproducible images, and use Kubernetes when the workload justifies the operational overhead. Record image digests and deployment manifests so teams can identify what ran.
-
Observability: Connect service metrics, logs, traces, and alerts. Dashboards and alert rules should help engineers investigate failures, not just display activity.
-
DevSecOps: Run dependency, image, and infrastructure checks in the pipeline. Define who can approve exceptions, where the decision is recorded, and how unresolved findings are tracked.
The handover also needs clear ownership. Assign a pipeline owner for each service, maintain runbooks for on-call engineers, and review incidents in a way that helps the team improve the system. DORA's 2023 research links generative organizational cultures and a focus on user needs with higher organizational performance.
Set baseline delivery measures before changing the pipeline. DORA's State of DevOps research program sets out four measures: deployment frequency, lead time for changes, mean time to recover, and change failure rate. Use them to assess both release throughput and stability, rather than treating a faster pipeline as success on its own.
| Capability | Early-stage signal | Target signal |
|---|---|---|
| Release process | Manual deployments in release windows | Automated pipeline from commit to production |
| Change failure rate | Frequent rollbacks and hotfixes | Stable releases with few failed deployments |
| Environment definition | Hand-configured servers | Versioned infrastructure as code reviewed like application code |
| Security checks | Scans run after release | Scans and policy gates in pipeline stages |
| Monitoring | Logs read only during incidents | Metrics, traces and alerts tied to each service |
Score each row from one to three, with one indicating that the early-stage signal describes the current state. Start with the weakest capability. Automating releases before teams can reproduce and review environment changes can make failures faster, not less frequent.
Measuring Success With DORA Metrics
| Metric | What it measures | How to calculate |
|---|---|---|
| Deployment frequency | How often a pipeline deploys successfully to production | Count the days with at least one successful production deployment |
| Change lead time | Time from code commit to production deployment | Subtract the commit timestamp from the production deployment timestamp, median per period |
| Change failure rate | Share of production deployments that cause a failure | Failed production deployments divided by total production deployments |
| Failed deployment recovery time | Time to restore service after a failed change | Time from incident start to restored service, median per period |
Read the four rows as a set. DORA's research pairs throughput with stability, so deployment frequency rising while change failure rate holds or falls is progress, and the same rise with a climbing failure rate is a warning worth acting on.
Counting is where dashboards go wrong first. Google Cloud's documentation on deployment metrics counts deployment days rather than deployments, so four production deployments on one day count as one, and it names deployment frequency as one of the four key DORA metrics. Fix the production target, the criteria for a successful deployment, the measurement window, and the handling of repeat releases before you compare two teams.
Lead time is the interval between the commit timestamp in source control and the production deployment timestamp in the deployment tool, reported as a median for the period. Both timestamps exist in nearly every stack, so there's little reason to estimate this from memory.
Change failure rate is failed production deployments divided by total production deployments. Write down what counts as failed before the first report, whether that's a rollback, a hotfix, or a severity-one incident, and take the reference bands from the current DORA publication each time you compare, because the bands move between editions and a band copied from an old summary will mislead a board. Track recovery time and deployment rework as separate series so the cost of shipping fast and repairing constantly stays visible.
Our guide to why engineering performance metrics matter covers the review rhythm that makes these definitions stick.
Report per service, then read four- to six-week trends. An average across services of different criticality hides the one pipeline that fails every third release.
Toolchain Options for CI/CD, Infrastructure and Observability
| Layer | Example options | Role in the pipeline | Choose when |
|---|---|---|---|
| CI/CD | GitHub Actions, GitLab CI, Azure DevOps Pipelines | Build, test, package and deploy from version control | The team already hosts code on that platform and wants pipelines beside it |
| Infrastructure as code | Terraform | Declare cloud resources in versioned files and plan changes before applying | Infrastructure spans more than one provider or account |
| Container orchestration | Kubernetes | Schedule, scale, and roll out containerized services | Services need horizontal scaling and controlled rolling releases |
| Observability | Prometheus and Grafana | Collect metrics, build dashboards and drive alerts | The team prefers open-source metrics with self-managed dashboards |
The layers are broadly interchangeable, and the actual cost sits in integration, identity, and the controls around the pipeline. Choose against the estate you already run: where source code is hosted, which identity provider issues your tokens, which cloud accounts exist, what your engineers can maintain without a training budget, and what audit log export each platform offers. A CI service picked for its popularity that logs into a different account from your SIEM creates reconciliation work for years.
Treat the pipeline as part of the software supply chain. NIST Special Publication 800-204D describes the pipeline as a sequence that moves source code through build, test, package, and deploy, with each stage representing an opportunity to apply supply-chain security controls. In practice, that means artifact integrity checks, dependency policy, traceable release records, and gates that block on defined thresholds, applied across the whole path to production.
Those controls matter more than the CI vendor you pick. Terraform, Kubernetes, and Prometheus with Grafana work with most CI platforms, so the decision can be made one layer at a time instead of as an estate-wide swap. If the open question is where the infrastructure should live, our cloud services work covers that choice separately from the pipeline.
Selection test: if the pilot service can't produce a versioned artifact and a recorded approval, the tool choice is still theoretical.
Pipeline speed is its own project, covered in our guide on how DevOps automation cuts deployment time. Test whichever combination you choose on that pilot first. It should produce a versioned artifact, a recorded approval, a tested rollback path, and a log trail you can still read a month later.
Phased Roadmap for the First 90 Days, Six Months and Twelve Months
Baseline first, then change. Google Cloud's summary of the 2023 DORA report sets out an order that holds up in practice: establish baseline performance on deployment frequency, change lead time, change failure rate and failed-deployment recovery time, map the value stream from commit to production, then automate build, test, security and deployment gates, then keep reviewing the numbers.
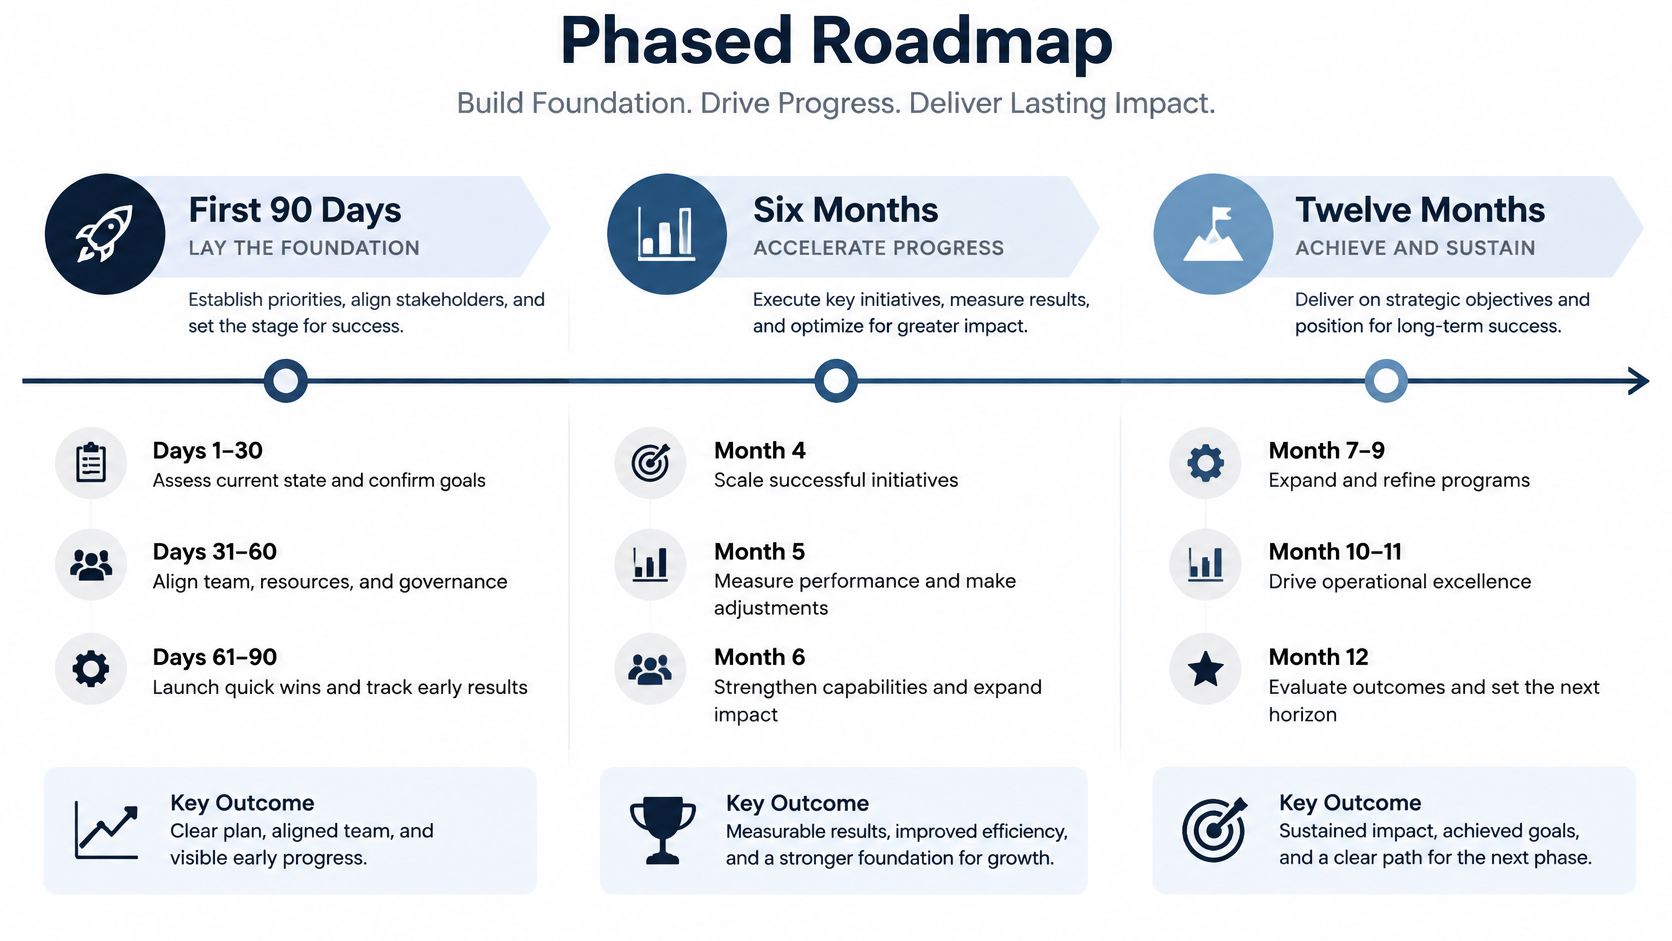
Days 1 to 90
Record baselines from pipeline and incident data you already have, then map the value stream and mark every wait between commit and production. Pick one low-risk service as the pilot, move its build, unit tests, and dependency scanning into CI, and put its infrastructure into reviewed code. Agree who owns each pipeline and who gets paged.
Exit condition: the pilot deploys from the pipeline without manual steps, and the four metrics are reviewed every sprint.
Months 4 to 6
Take the rest of the estate in waves. Add container image scanning, protected branches with required reviews, canary or blue-green releases, and an exception process with named owners and expiry dates. Track every change in the client's own project management platform, so release history and tickets tell the same story.
Exit condition: every in-scope service deploys through the pipeline, with exceptions documented and dated.
Months 7 to 12
Add service-level objectives, a scheduled alert review, automated rollback criteria, and an on-call rotation with runbooks. Monitoring continues after deployment to catch emerging threats, and the alert rules get pruned as the team learns which pages lead to action. Where hosting itself needs to change during the year, our guide to cloud migration consulting services covers how to sequence that move without stalling delivery.
Exit condition: the on-call rota is staffed, runbooks have been tested in a drill, and rollback criteria are written into the pipeline.
Practical rule: if change failure rate isn't on the same dashboard as deployment frequency by month one, you're reporting activity rather than delivery.
Keeping Audit Trails and Segregation of Duties in DevOps
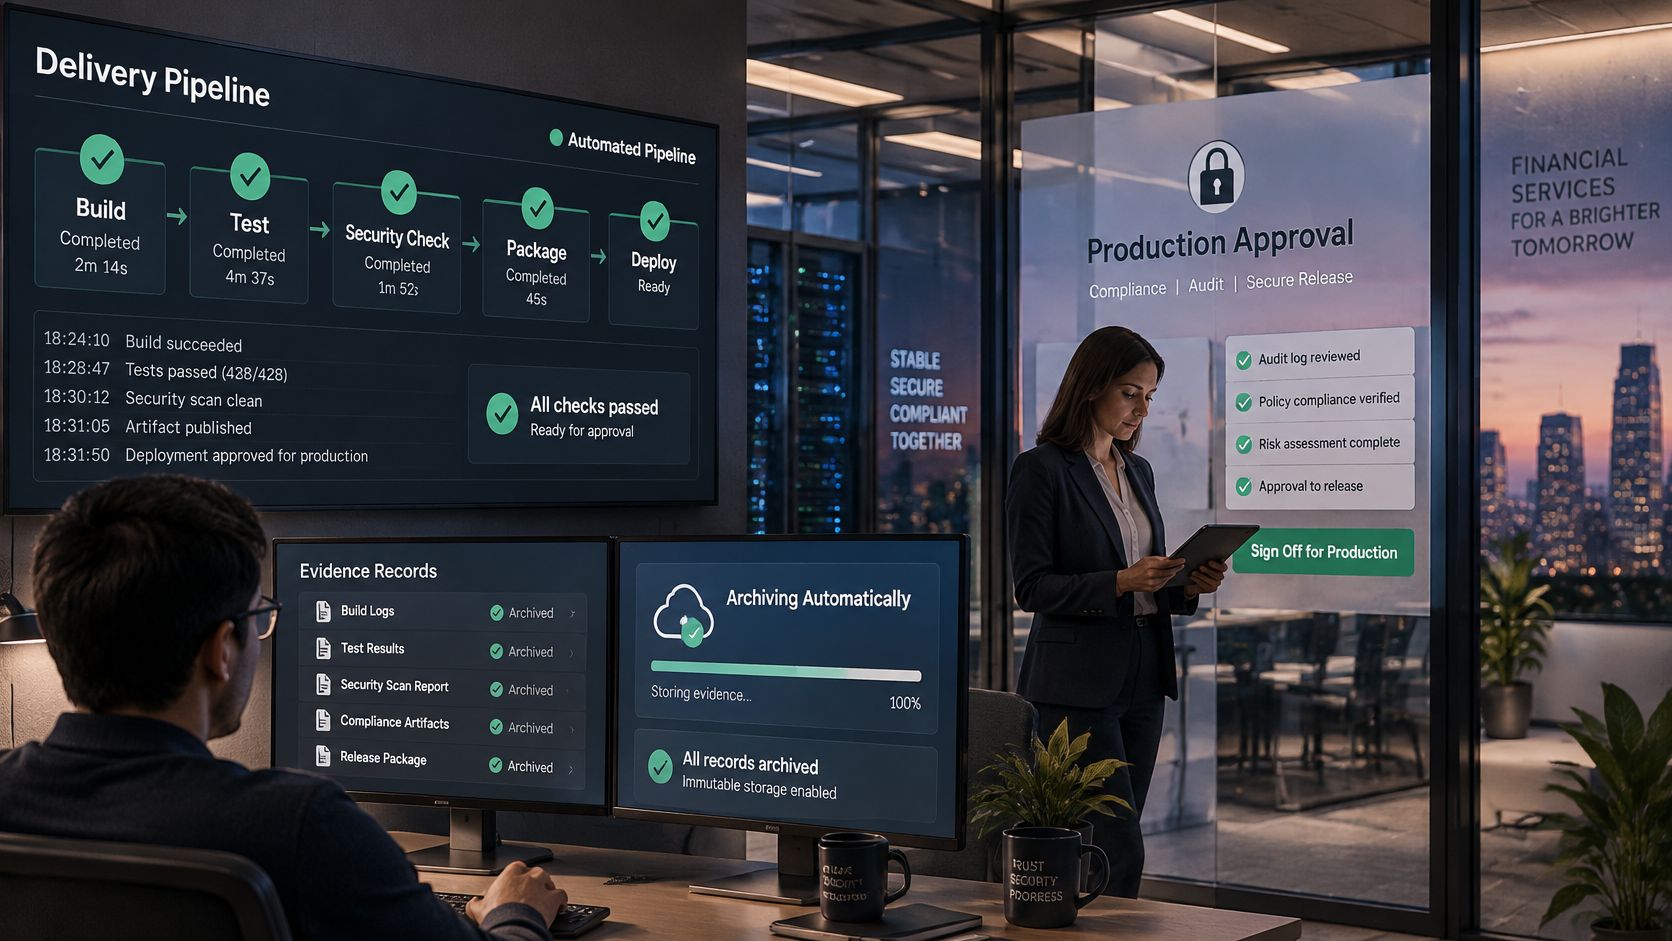
Can a regulated team automate releases without losing control over who approves production changes? Yes. Automate builds, tests, security checks, and evidence collection, then use a risk-based approval gate where production changes require human authorization. Design audit evidence and release accountability into the first pilot, alongside the automation.
What the pipeline has to produce
-
Traceable requirements: Link each commit to the requirement or ticket it addresses.
-
Test evidence: Attach results to the build they validate, not to a separate spreadsheet.
-
Controlled approvals: Record the approver, timestamp, and criteria applied.
-
Immutable audit logs: Preserve append-only records of code, build, and deployment events.
-
A software bill of materials: Keep a component list for each release.
-
Rollback criteria: Document the rollback threshold and name the release owner responsible for acting on it.
Segregation of duties needs to be built into pipeline permissions. An engineer should not be the sole approver of their own change. Give pipeline service accounts only the permissions they need, protect branches with review requirements, and log break-glass access for scheduled review.
Mapping controls to regulated products
For medical-device and SaMD teams, the FDA's cybersecurity resources for manufacturers state that Section 524B of the Federal Food, Drug, and Cosmetic Act took effect on March 29, 2023. It requires manufacturers of qualifying cyber devices to submit specified cybersecurity information, including postmarket update and patch procedures. The guidance also identifies a software bill of materials covering commercial, open-source, and off-the-shelf components as a submission element. Make component visibility, vulnerability response, and patch evidence pipeline outputs rather than documentation assembled after release.
Health systems need controls around data exchange as well. Bridge Global supports structured healthcare integrations using HL7, FHIR and DICOM, with validation, monitoring, audit logging and secure error management. Insurance software covering claims automation, underwriting and policy platforms also needs controls that connect changes to approvals and retained evidence.
Financial-services teams should map the same control set to the change-management obligations defined by their regulators and internal audit function. Confirm the requirements with compliance before configuring approval gates. Then document which role approves each change and what evidence the control requires. The pipeline should produce records an examiner can review, with each approval attributed to a named person.
Choosing a DevOps Implementation Partner and Avoiding Pitfalls
A proposal earns a second meeting when it contains all of the following, in writing.
-
Baselines in week one: A plan to record the four DORA measures from your existing data before any tool change.
-
Retained evidence: How pipeline runs are reviewed, stored, and produced on request.
-
An exception process: Named owners, expiry dates, and compensating controls for security findings.
-
Knowledge transfer: Pairing sessions and runbooks, with your engineers writing parts of the pipeline.
-
Named owners after handover: Specific roles, not "the team".
-
Exit terms: Repository and infrastructure ownership, credential rotation and access removal at the end of the engagement.
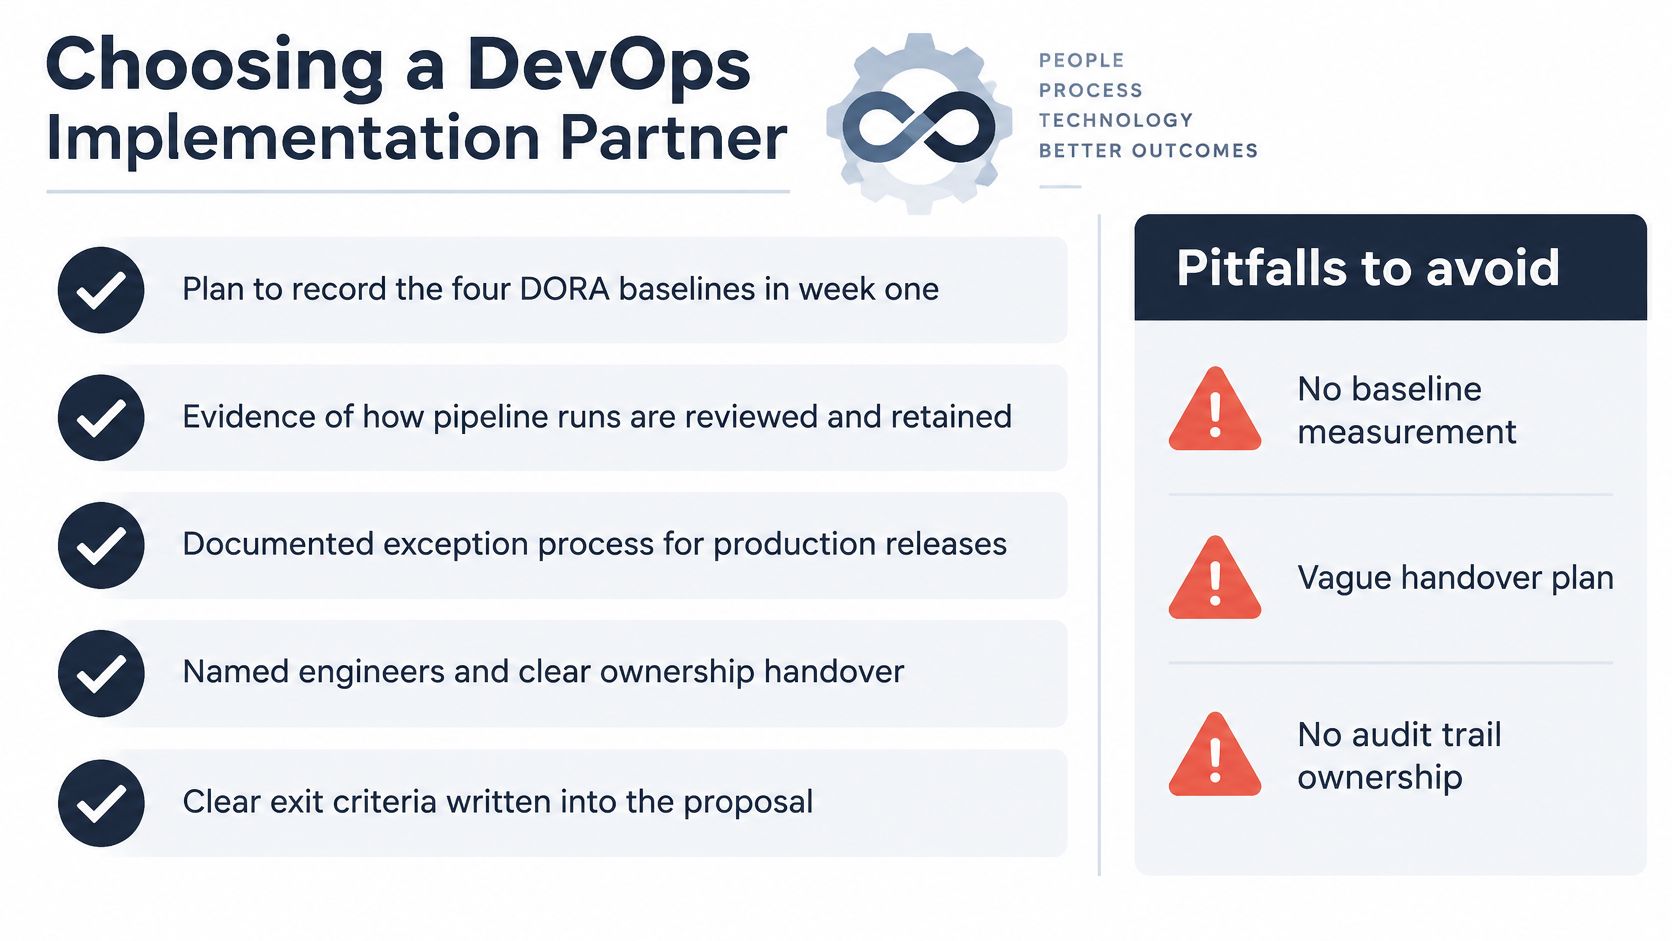
The failure patterns are predictable, which is the good news. Each one has a fix that costs less than the mistake.
-
Tools before the value stream: Buying Kubernetes and a scanning suite before mapping the release process guarantees a mismatch. Map first and let the assessment choose the tools.
-
Automation without an owner: A pipeline nobody owns decays within a quarter. Name one owner per pipeline in the statement of work.
-
Speed targets without stability gates: Deployment frequency alone rewards recklessness. Report it beside change failure rate on the same page.
-
Governance as manual review queues: Approval meetings slow delivery and produce weak evidence. Build controls into the shared platform as reusable capabilities.
-
AI coding gains lost downstream: Google Cloud's announcement of the 2025 DORA report notes that AI adoption improves throughput while still showing a negative relationship with delivery stability, and DORA's 2025 report infographic records that 90% of nearly 5,000 surveyed technology professionals use AI at work while 30% report little or no trust in AI-generated code. Measure the whole value stream, with accountable human review and named rollback procedures.
Teams that want to see how Bridge Global scopes this work can start on the services page.
Engagement Models and Cost Drivers
Three models cover most of what buyers sign, and they line up with the software development service models a partner will offer: a dedicated team, full-cycle software delivery, and co-creation with in-house teams. Each changes who carries the outcome, so the choice matters more than the day rate.
| Model | Best fit | Who owns delivery outcomes | Main risk |
|---|---|---|---|
| Dedicated team | Roadmap work over an extended period with a stable scope | Shared, with the client setting priorities | Knowledge stays with the provider if handover is not planned |
| Full-cycle delivery | Buyers who want one accountable party for the path to production | The provider, against agreed service levels | Weak internal ownership after the engagement ends |
| Co-creation with in-house teams | Organizations whose engineers will run the platform after handover | Shared between the provider and the internal team | Slower decisions when responsibilities overlap |
Cost moves with five inputs: the number of services and environments in scope, how deep the baseline has to go, the evidence your regulators require, how many tool layers need migrating rather than extending, and how much knowledge transfer you expect. A quote that ignores those inputs is a placeholder with a number attached.
Ask for an itemized estimate that states team size, duration, assumptions, and exclusions. Any figure you receive before those assumptions are written down is an indicative estimate, and the assumptions are the part worth negotiating in the first call.
Buying rule: the 90-day pilot is the cheapest interview you’ll run before committing to a year.
I’d test a provider with the fixed first 90 days before signing a longer model. That phase produces a baseline and a working pipeline, which gives you direct evidence of how the team documents, how it works with your engineers, and how it behaves when a deploy fails.
Answers to Buyer Questions About DevOps Implementation
Frequently Asked Questions
How long does a DevOps implementation take?
Scope decides this more than anything else. The first 90 days are a pilot phase that produces baselines and one fully automated service, and the rest of the estate usually takes several more months, depending on how many services and environments are in scope.
What should the budget include?
Team size, the number of services and environments, the evidence your regulators need, and how much knowledge transfer you want. Ask for an itemized estimate with stated assumptions, because a headline figure without those assumptions tells you very little.
Do we have to replace our current tools?
Usually not. The layers can be mapped one at a time, and many teams keep their source control and issue tracking while adding CI, infrastructure as code, and observability around them.
Which metrics belong in a board report?
The four DORA measures per product area, with change failure rate and recovery time shown beside deployment frequency and lead time. Speed on its own rewards recklessness.
Can automation satisfy audit requirements?
It carries most of the evidence collection, including approvals, test results, and component lists. Release approval and accountability stay with named people, and your compliance function owns the mapping to specific obligations.
Bridge Global’s DevOps services improve builds, deployments, automation, monitoring, and infrastructure so engineering teams release software more reliably, and the work runs alongside your in-house engineers through whichever service model fits your roadmap. If you’re comparing partners, ask each one to scope the first 90 days in detail, with baselines, a pilot service, and named owners written into the plan. Visit Bridge Global to see how the delivery models and engineering teams fit together.

About Upendra Jith
Upendrajith completed his Master's in English and has been a commercial content developer for the past three years. He's more inclined to develop content with a 'street-smart' delivery on topics such as technology, media, or anything he can get his hands on. He has a fixation on lyrics, dark poetry, media, technology, and flow arts.
View all posts by Upendra Jith →