



Engineering Performance Metrics That Actually Matter
Most engineering scorecards reward the wrong layer of work. They glorify commit volume, pull-request counts, and deployment frequency, then leave leadership blind to the critical question: whether engineering is improving customer outcomes, patient safety, revenue, and risk.
That's why so many dashboards look healthy while delivery still slips, support load rises, and audit findings keep showing up. Engineering Performance Metrics should measure the system that ships value, not the noise that surrounds it. If a number doesn't predict a customer, patient, or revenue outcome, it belongs under review, not in a board deck.
Why Most Engineering Scorecards Measure the Wrong Layer
The oldest mistake in software measurement is still the most common, confusing activity with progress. Early productivity benchmarking relied on lines of code per person-month, but that rewarded volume rather than value. Later function points helped measure delivered functionality more consistently across languages, and the historical record shows why that shift mattered: Allan Albrecht's study of 24 business-application projects, ranging from approximately 3,000 to 318,000 lines of code, found productivity measured with function points improved by a factor of 3 over the study period, according to the University of California, Irvine's software productivity archive.
In modern teams, the same mistake shows up as green dashboards with red outcomes. A team can ship often and still drown in rework, incident response, or compliance work that never gets credited because it doesn't resemble “output.” That's especially dangerous in regulated environments, where the hard part isn't typing code; it's proving the code is safe, traceable, and recoverable.
The diagnostic question that cuts through vanity metrics
Ask one question of every number on the board: does it predict a customer, patient, or revenue result, or does it merely describe engineering activity? If the answer is the second one, keep the metric only if it helps explain the first.
Practical rule: if a metric can rise while support tickets, defects, or audit pressure also rise, it's not a performance metric. It's an activity log.
A useful one-page audit is simple. List every metric, label it as throughput, stability, quality, or engineering health, and then write the paired outcome it should protect. If there's no paired outcome, the metric is probably being used to make leadership feel informed rather than to make the organization better.

The Engineering Performance Metric Categories You Need
A scorecard fails when it rewards the wrong layer of work. The useful categories are throughput, stability, quality, and engineering health. That hierarchy keeps leaders from mistaking activity for progress, and it forces every metric to answer a business question instead of an internal vanity question.
-
Throughput tells you how quickly value moves.
-
Stability tells you whether release work survives contact with production.
-
Quality tells you how much escapes review and testing.
-
Engineering health tells you whether the system is getting harder to change.
Throughput and stability work as a pair
Throughput metrics belong at the front of the scorecard. They show how often teams ship and how long code waits before production. Stability metrics belong beside them, because speed that creates incidents is just expensive motion.
Many scorecards mislead leadership. A team can move fast and still create more interruption than value if recovery is slow and change failure is high.
Quality and engineering health stop the scorecard from lying
Quality covers whether the output holds up once it leaves the team. Defect density, escaped defects, code-review effectiveness, rework, and vulnerability findings all fit here.
Engineering health is the layer executives ignore until delivery slows. Review burden, technical debt, developer experience, and on-call load belong here because they shape future throughput and future stability. If this layer gets worse, every other category starts to drift.
| Category | What it answers | Example metric |
|---|---|---|
| Throughput | How fast value moves | Deployment frequency |
| Stability | How safely value ships | Recovery time |
| Quality | How much escapes review | Defect density |
| Engineering health | Whether the system is getting harder to work in | Review burden |
Before a scorecard conversation, it helps to know the top engineering interview questions list that strong teams can already answer.
Lead Time, Cycle Time, MTTR, and Defect Escape Rate Explained
Definitions matter because leaders often use these terms loosely, then compare numbers that measure different time windows. The DORA metrics guide defines change lead time as the elapsed time from code commit to successful production deployment, deployment frequency as the rate of production deployments, and failed-deployment recovery time as the time required to restore service after a failed release. Standardize those meanings before debating performance.
What each metric really tells you
Lead time measures flow from commit to production, but segmentation determines whether it supports a useful decision. A short median can conceal slow tail cases, so report percentiles for lead time and recovery time rather than relying on averages. Cycle time covers the development stages around a pull request, not the full path to production. Keeping the two measures separate shows whether work is waiting in development, review, release, or another part of the pipeline.
MTTR, or mean time to recovery, requires incident severity to remain visible. Recovery from a low-risk interface issue should not carry the same weight as restoring a production system that handles protected data. Report the severity band beside the recovery time, or leadership will reward easy recoveries while serious incidents disappear inside an attractive average.
Defect density measures defects relative to software size. Defect escape rate measures issues that survive earlier quality gates and appear later or in production. A lower defect count can indicate better quality, or it can show that detection has weakened. Pair the metric with test coverage, review findings, and production reports before calling the trend positive.
Recovery time without severity is a vanity metric. It flatters teams that mostly recover easy failures and hides the incidents that really matter.
| Metric | Definition | What it really measures | Common trap |
|---|---|---|---|
| Lead time | Commit to successful production deployment | Delivery flow across the pipeline | Averaging away slow tail cases |
| Cycle time | Time spent in development stages before merge and release | Where work gets stuck | Confusing it with release latency |
| MTTR | Time to restore service after a failed release | Recovery capability | Mixing minor and severe incidents |
| Defect escape rate | Defects found after earlier gates | Effectiveness of reviews and tests | Celebrating fewer reported defects when detection fell |
| Defect density | Defects divided by software size | Normalized quality risk | Comparing unrelated codebases without segmentation |
Use these definitions alongside the top software development productivity metrics when expanding a scorecard. Standardize these five definitions first. Metric arguments usually shrink once every team measures the same elapsed window.
Selecting Metrics Tied to Real Business Outcomes
Choose metrics from the outcome backward, never the other way around. If the business goal is reducing patient onboarding friction, the engineering board should not start with story points or total commits. It should start with a customer outcome, then ask which flow, stability, quality, and engineering-health signals best predict it.
Use a three-question filter
First, does the metric predict a customer, patient, revenue, or risk outcome? If it doesn’t, it’s not a primary metric. Second, can you move it without damaging a paired metric? Throughput without stability is usually a trap. Third, can you segment it by service criticality and compliance impact? If not, the metric is too blunt for serious use.
A healthtech SaaS platform that wants to reduce onboarding friction might track shorter commit-to-production lead time on low-risk UI work, fewer escaped defects in identity and consent flows, faster recovery on onboarding incidents, and lower review burden on the team maintaining integrations. That gives leadership a tiered view of the system, not just the visible layer.
Retire vanity numbers without turning it into a fight
The easiest way to kill a vanity metric is to replace it with a clearer decision. If nobody makes a different choice when the metric moves, it doesn’t need to be on the board. If Bridge Global is helping a team structure this kind of scorecard, its engineering productivity leader’s guide is a relevant companion reference.
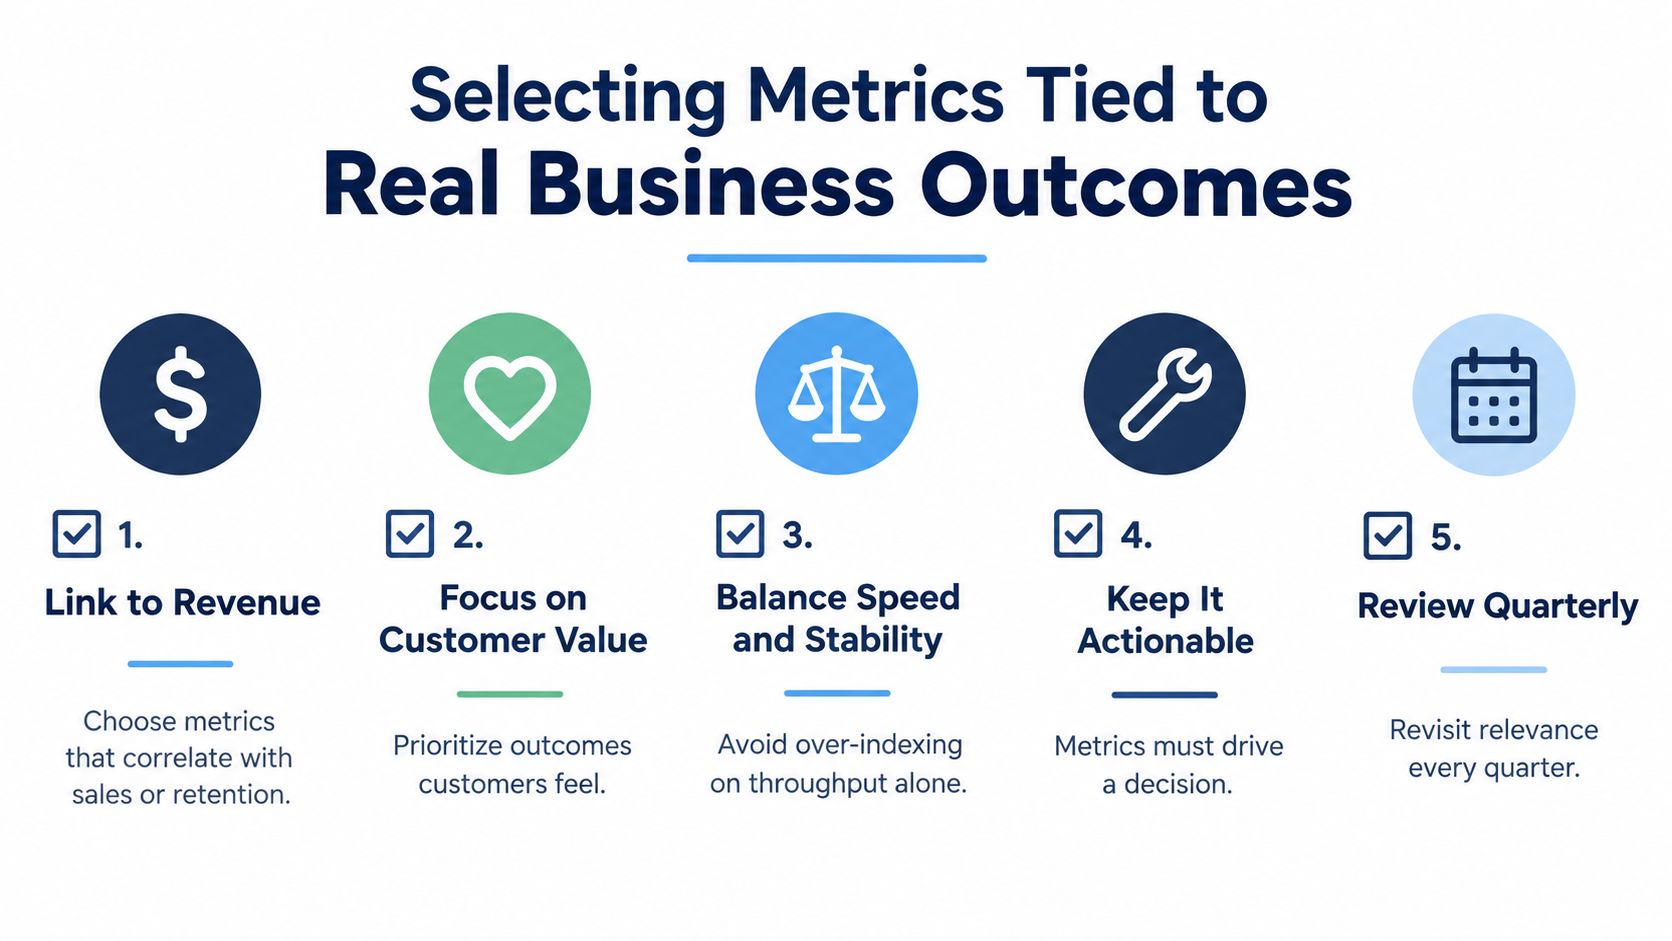
A metric is worth keeping only if it helps choose between two actions. If a board can’t point to the decision it will make from the number, the number is decoration.
Implementation Roadmap From Data to Governance
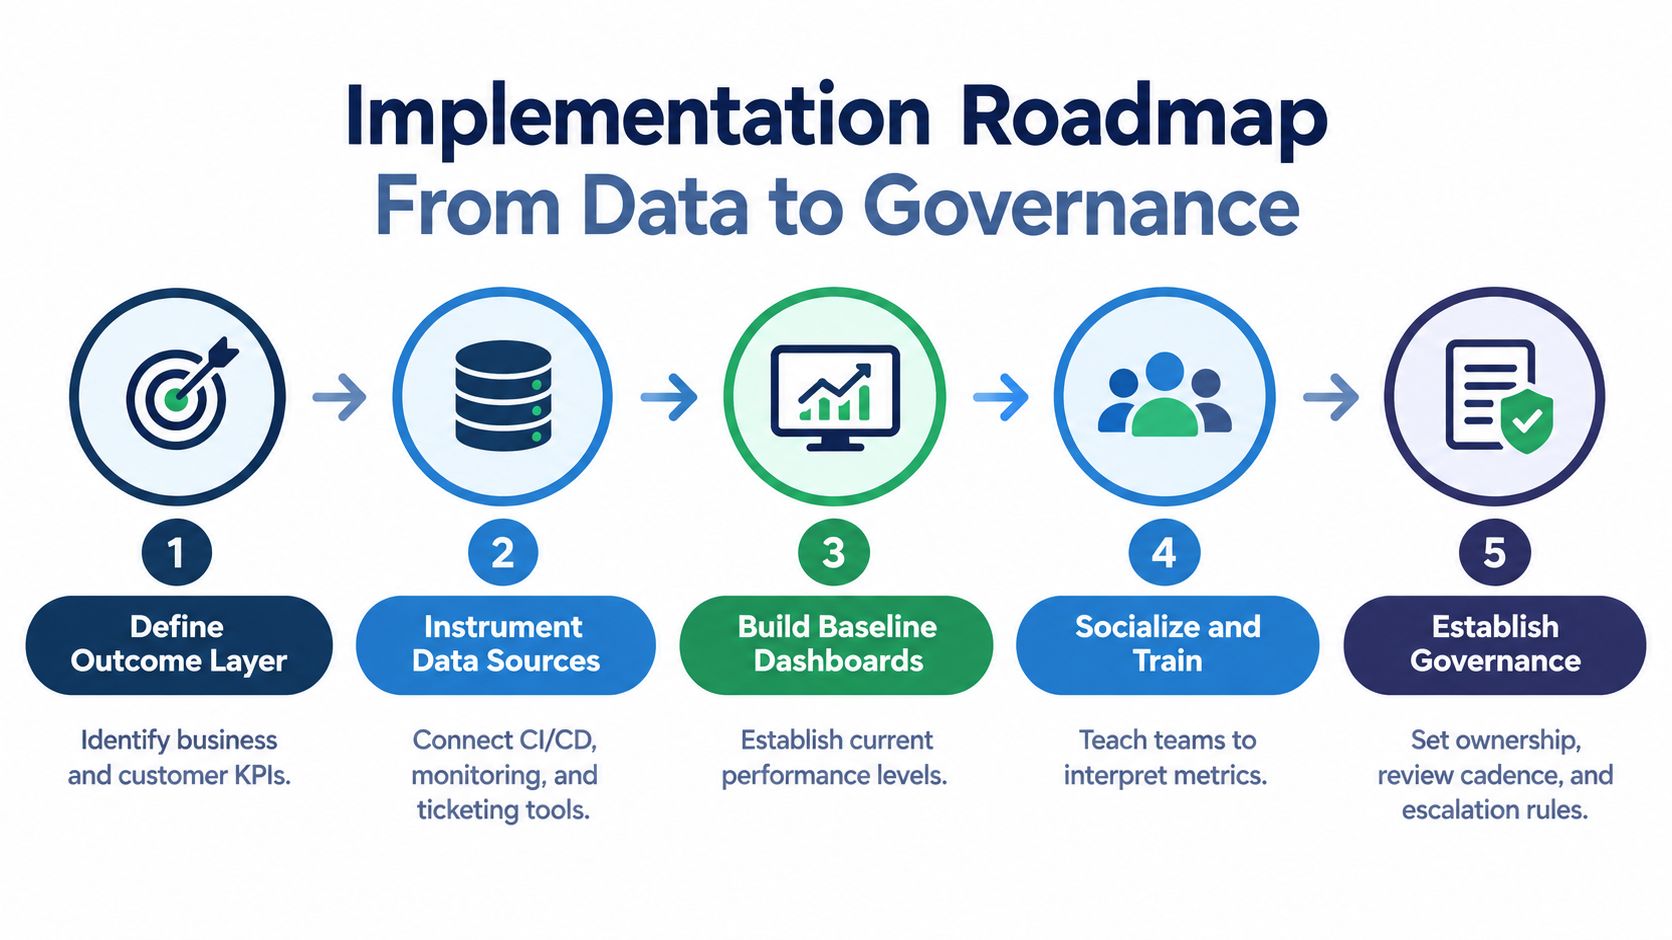
Rollout fails when teams instrument everything before deciding what leadership needs to improve. Start with the patient, customer, or revenue outcome, then build the engineering scorecard beneath it. The practical sequence is clear: define the outcome, choose a small set of primary metrics, connect telemetry, create role-specific dashboards, and establish governance.
Build the stack in the right order
Use existing sources first: version control, CI/CD, incident management, and production observability. Together, they support measures of delivery flow, recovery, and quality without forcing a vendor-specific framework. Add separate views for delivery leads, platform or DevEx teams, and executives. Each audience needs a different level of detail and a different decision context.
The dashboard should also preserve the hierarchy established during metric selection. Outcome measures belong at the top. Engineering signals explain movement beneath them, while operational detail helps teams diagnose causes. This structure keeps faster delivery from being mistaken for better service when incidents, defects, or compliance exposure rise.
Treat the first 90 days as a diagnostic period
Early numbers will be noisy. Instrumentation gaps appear, baselines shift, and teams with better telemetry may initially look weaker. Use this period to repair definitions, check data quality, and document differences in service criticality. Governance should make the numbers readable and prevent them from becoming a ranking system.
Here is the implementation checklist for a platform lead:
-
Define the outcome layer: Write the business and customer KPIs first.
-
Select one primary metric per category: Keep the initial board small.
-
Connect the telemetry sources: Pull from version control, CI/CD, incidents, and observability.
-
Publish separate views: Delivery, platform, and executive dashboards should not look identical.
-
Establish monthly review: Reset targets, retire dead metrics, and document what changed.
For teams evaluating delivery models during rollout, Bridge Global’s software development service models page provides a useful anchor for the operating discussion. Keep the closing decision focused on ownership, data quality, and the outcomes the scorecard must improve.
Pitfalls and Anti-Patterns That Quietly Break Teams
The worst metric programs don’t fail loudly. They create a culture of performance theater. The dashboard looks busy, leaders feel informed, and the teams learn how to game the numbers without improving the product.
The anti-patterns that keep showing up
Optimizing throughput without stability is the classic failure. Deployment counts go up, incidents follow, and the team spends the next sprint cleaning up the mess. Ranking individual developers is another. DORA metrics are team and system signals, and once you use them in performance reviews, people will split batches, hide risk, and optimize for what gets measured instead of what gets shipped.
AI makes this worse if leadership mistakes AI-generated activity for productivity. Recent DORA research shows that a 25% increase in AI adoption was associated with a 7.5% improvement in documentation quality, a 3.4% improvement in code quality, a 3.1% increase in code-review speed, a 1.3% increase in approval speed, and a 1.8% decrease in code complexity, while delivery throughput still moved in the wrong direction. That means local efficiency can rise while end-to-end delivery worsens.
Measure AI as a change in system behavior, not as a count of prompts, completions, or generated files.
The correction is boring, and that’s the point
Use paired metrics. Keep one metric for flow and one for stability. Segment by service criticality. Never tie the board metric to individual rewards. If nobody outside engineering can read the dashboard, rewrite it.
The other trap is benchmark worship. Context matters. A low-risk UI release and a database migration affecting regulated data should never be judged on the same line. Good scorecards make responsible behavior visible. Bad ones punish the teams doing the hardest work.
Industry Notes for Healthtech, Finance, and Insurance
Regulated teams need the same core engineering metrics, with stricter context around them. A healthtech SaaS platform should not group every release together. A user-interface update and a change affecting protected health information carry different risk, so segment flow metrics by service criticality, release type, and compliance impact.
What changes in regulated environments
Healthtech scorecards should include audit readiness, validation effort, data-class severity, and compliance lead time. Finance teams should track change-failure severity alongside remediation time, since a rapid fix can still leave material risk unresolved. Insurance teams need visibility into segregation of duties and approval latency. A release process that ignores control design can create reporting risk later.
Show the time responsible engineering work requires. Extra review, test evidence, and documentation are expected when a system handles regulated data. That extra time is the price of being safe in a regulated system. Comparing this work with a consumer feature team’s output produces a misleading scorecard.
For a practical example of operational data supporting regulated software teams, read this healthcare operational analytics guide.
A simple audit-ready checklist
-
Segment by data class: Keep low-risk interface work separate from changes that touch PHI.
-
Track severity, not just counts: Security, privacy, safety, and functional defects require different responses.
-
Add compliance lead time: Measure the waiting introduced by approvals and validation.
-
Report recovery separately: Recovery speed matters only alongside the severity and scope of the incident.
-
Show rework: Production fixes reveal where controls, testing, or requirements are weak.
Keep the scorecard tied to patient safety, customer trust, and revenue protection. In healthtech, that means connecting engineering signals to safe care delivery and audit readiness. In finance, connect them to transaction integrity and loss prevention. In insurance, connect them to accurate reporting, controlled releases, and dependable claims operations.
Bridge Global’s custom healthcare software development services provide a relevant reference point for teams aligning engineering measures with regulated delivery. Use the same discipline internally: retain metrics that expose risk and outcomes, and drop activity measures that reward volume without showing whether patients, customers, or the business are better protected.
Frequently Asked Questions
How often should engineering metrics be reviewed?
Review operational signals weekly within teams and monthly for governance. Reset targets quarterly, since a target can remain in place after the conditions that made it useful have changed.
What should we do if one team is always the outlier?
Treat the outlier as a diagnostic signal before treating it as a performance problem. Break results down by service, release type, and work class. Then check whether the team handles more compliance work, legacy debt, or integration complexity than its peers. Adjust comparisons before changing targets or staffing.
Should AI coding tools be measured separately?
Measure AI-assisted work separately for analysis, not as a score for individual engineers. Track usage, review burden, rework, and quality, then connect those signals to delivery speed and system stability. If AI changes the unit of output, drop activity counts that no longer explain customer value, and retain measures for reliability, risk, and outcomes.
How do we explain this to a board?
Start with the business outcome, then show the small set of engineering signals that predict it. A board needs to know whether delivery capacity, quality, and resilience support patient safety, customer trust, or revenue protection. A dashboard dump obscures that decision.
Where can teams see this kind of framework in practice?
Bridge Global’s client cases show how engineering decisions surface in real delivery work. Choose a case close to your industry and trace which delivery, quality, and outcome measures the team paired.
Three decisions matter this quarter: choose one outcome, pair each throughput metric with a stability guardrail, and stop using individual activity as a proxy for performance.
Bridge Global helps teams connect engineering signals with product, customer, and revenue outcomes. Teams that need support shaping metrics, telemetry, and governance can visit Bridge Global.

About Upendra Jith
Upendrajith completed his Master's in English and has been a commercial content developer for the past three years. He's more inclined to develop content with a 'street-smart' delivery on topics such as technology, media, or anything he can get his hands on. He has a fixation on lyrics, dark poetry, media, technology, and flow arts.
View all posts by Upendra Jith →