



Predictive Analytics in Healthcare: A Practical Build Guide
Predictive analytics in healthcare means using statistical or machine learning models to estimate the probability of a future clinical or population event from data that exists at the moment of prediction, so a care team can act before that event happens. You probably already have a model with a respectable AUC in a notebook and a product review next week where someone asks when it ships. What decides whether it ships well sits around the score: whether it's calibrated for the patients in front of you, which action it triggers, and how you prove it still works after a ward changes its protocol.
Where Predictive Analytics Pays Off in Clinical Care
Predictive analytics in healthcare begins with a decision somebody has to make under time pressure. The model returns a probability and the care team returns an action. If nobody can name the action, you have a research question wearing a product badge.
Predictive work has dominated healthcare analytics research for years. A 2018 systematic review of healthcare-analytics research found predictive analytics in 43% of the articles examined, with clinical decision support the leading application area across chest pain, myocardial infarction and morbidity risk. That breadth cuts both ways for a product team: the evidence base is large, and most of it stops at the model, well before anyone runs an alert on a live ward.
The five use cases below cover most of what healthtech platforms get asked to build. Read the horizon column first, because it sets your data latency budget.
| Use case | Prediction target and horizon | Data it needs | Action it triggers |
|---|---|---|---|
| Readmission risk | Unplanned readmission within 30 days of discharge | Index admission diagnoses, prior utilisation from EHR or claims, medication lists, discharge disposition, social-risk fields where captured | Discharge planning, follow-up call, pharmacist medication review |
| Deterioration and sepsis early warning | Organ dysfunction or sepsis within a window set by the clinical team, typically hours | Vital sign time series, laboratory results such as lactate and white cell count, nursing assessments, medication orders | Bedside review, escalation to rapid response or sepsis protocol |
| Chronic disease risk | Incident type 2 diabetes or cardiovascular event over multi-year horizons | Laboratory history, blood pressure, smoking status, diagnoses, prescriptions, claims history | Preventive outreach, screening recall, care management enrolment |
| No-show prediction | Appointment attendance at the next scheduled visit | Scheduling history, booking lead time, reminder response, distance proxies | Reminder cadence and overbooking rules (covered in the operations guide) |
| Capacity and bed demand | Inpatient census and bed demand over the next 24 to 72 hours | ADT feeds, census, procedure schedules, seasonal and day-of-week patterns | Staffing and bed management decisions (covered in the operations guide) |
Two rows move the engineering. Readmission runs on a 30-day target, so a nightly batch is fine, and you can tolerate claims data that lags a week. Sepsis and deterioration work on a window measured in hours, which means streaming vitals, sub-minute scoring, and a screen a nurse can read at 3 AM without scrolling twice. Chronic disease risk sits at the far end, with multi-year horizons that suit Pooled Cohort Equations or QRISK3-style calculators refreshed monthly.
No-show and capacity forecasting belong to the operational side of the same platform. Our guide to predictive analytics in healthcare operations covers those workflows. This article stays on clinical and population prediction and on how models get built, validated and pushed into production.
Data Foundations for Clinical and Population Models
A model that scores a patient at hour six cannot use information recorded at discharge. That timing rule shapes the data pipeline: every feature must be available at the moment of prediction, consistently across sites.
What each source family contributes
Electronic health records provide vitals, laboratory results, medications, diagnoses, and notes. Standard codes support exchange across systems, but they do not erase differences in clinical documentation or billing practices. Free text needs processing before it can become a model feature, and structured fields can still vary between sites.
Claims provide longitudinal diagnosis and service histories across a population, often with weeks or months of delay. They rarely include vitals or laboratory values. Device and remote-monitoring data arrive at higher frequency, but missing readings and hardware artefacts can obscure a patient's actual condition. Registries and social-risk fields add context absent from claims, though they may be sparse or collected for a different purpose.
Patient-reported outcomes can add information that clinical records miss, but their availability does not guarantee their use in prediction. A systematic scoping review of predictive analytics in telecare and telehealth found that patient-reported-outcome tools appeared in some papers, while their use in predictive models was limited. Check whether these measures are collected consistently, at the right point in the care pathway, and for the population the model will serve.
The checks before feature engineering
Run data checks by site and time period. Pooled summaries can hide a feed that stopped arriving or a field that changed meaning.
-
Completeness: Track missingness by field, site, and month. A new interface or decommissioned lab feed should appear as a change in the data, not as a surprise during model evaluation.
-
Timestamp integrity: Keep collection time distinct from result time. The difference determines whether a result was available when the prediction would have been made.
-
Unit harmonisation: Convert values such as mg/dL and mmol/L before combining measurements.
-
Duplicate records: Resolve patient identities before calculating utilisation or counting events.
-
Code-set changes: Record coding updates and check whether they alter cohort definitions or feature meaning.
Then test for feature leakage. Each input must have been available at the prediction time, at every site. A discharge summary may be valid for a score calculated at discharge, but not for a prediction made earlier in the admission.
Interoperability and data quality can obstruct implementation, as can validation across sites and populations. Treat these as pipeline design concerns, not problems to postpone until model training. Define the outcome and its time window before engineering features. For exchange and analysis, healthcare data pipeline architecture offers a useful view of the underlying plumbing.
Building and Validating a Model That Holds Up
Start with an auditable baseline
I'd open every clinical prediction project with a regularised logistic regression. It trains in minutes, a clinician can read the coefficients, and it gives you a reference that any richer model has to beat on calibration and subgroup behaviour, not only on ranking. Gradient-boosted trees usually win on wide tabular feature sets from EHR and claims data with nonlinear interactions. Deep sequence models earn their place on high-frequency vitals or notes, and only when you have the volume to feed them, the latency budget to serve them, and the governance to explain a less transparent output.
Model validation is unglamorous work, and it's where clinical prediction projects fail.

Validate outside the development site
Split by time, never at random. A random split lets a patient's later admission leak into training and inflates the number you take to the board. External validation means testing on a different but relevant dataset, and expert clinical-prediction guidance breaks it into five stages: obtain an appropriate dataset, generate predictions, assess performance, evaluate clinical usefulness, and report results transparently.
Discrimination and calibration answer different questions. A model can rank patients in the right order while overstating absolute risk for all of them. In an external validation of healthcare-cost prediction models among nationally representative U.S. older adults, a model combining claims-derived variables with cohort measures reached AUC 0.78 in women (95% CI 0.74 to 0.82) and 0.77 in men (95% CI 0.73 to 0.81), with substantial agreement between predicted and observed costs. Adding functional impairment and frailty variables produced a modest gain, which frames the trade-off you should price early: extra collection, integration, privacy, and maintenance work has to be justified by the discrimination it buys.
| Metric | What it tells you | Reporting expectation |
|---|---|---|
| AUROC | Ranking ability across all thresholds | Report with 95% confidence interval and the validation dataset |
| AUPRC | Precision and recall for rare outcomes | Report with outcome prevalence, since it depends on prevalence |
| Calibration-in-the-large | Whether mean predicted risk matches observed risk | Ideally 0 |
| Calibration slope | Whether predictions are too extreme or too flat | Ideally 1 |
| Brier score | Overall error of predicted probabilities | Compare against a prevalence-only baseline |
| Decision curve net benefit | Clinical usefulness at the chosen thresholds | Compare against treat-all and treat-none strategies |
Fairness and explainability that survive clinical review
Subgroup analysis belongs in the same report as the headline number. Cut results by age, sex, language, site and, where lawfully collected, race and ethnicity, and read the false-negative rate and calibration for each group. A pooled AUROC hides the group your model misses.
Global feature importance, local attributions and counterfactual examples serve different audiences and shouldn't be conflated. An explanation describes model behaviour, and clinicians will read it as disease mechanism unless you say otherwise in the interface. Close the package with a documented decision threshold and a written limitations statement that names the excluded populations.
Deploying Predictions into Clinical Workflows
The integration pattern you choose fixes your latency budget before anyone writes model code.
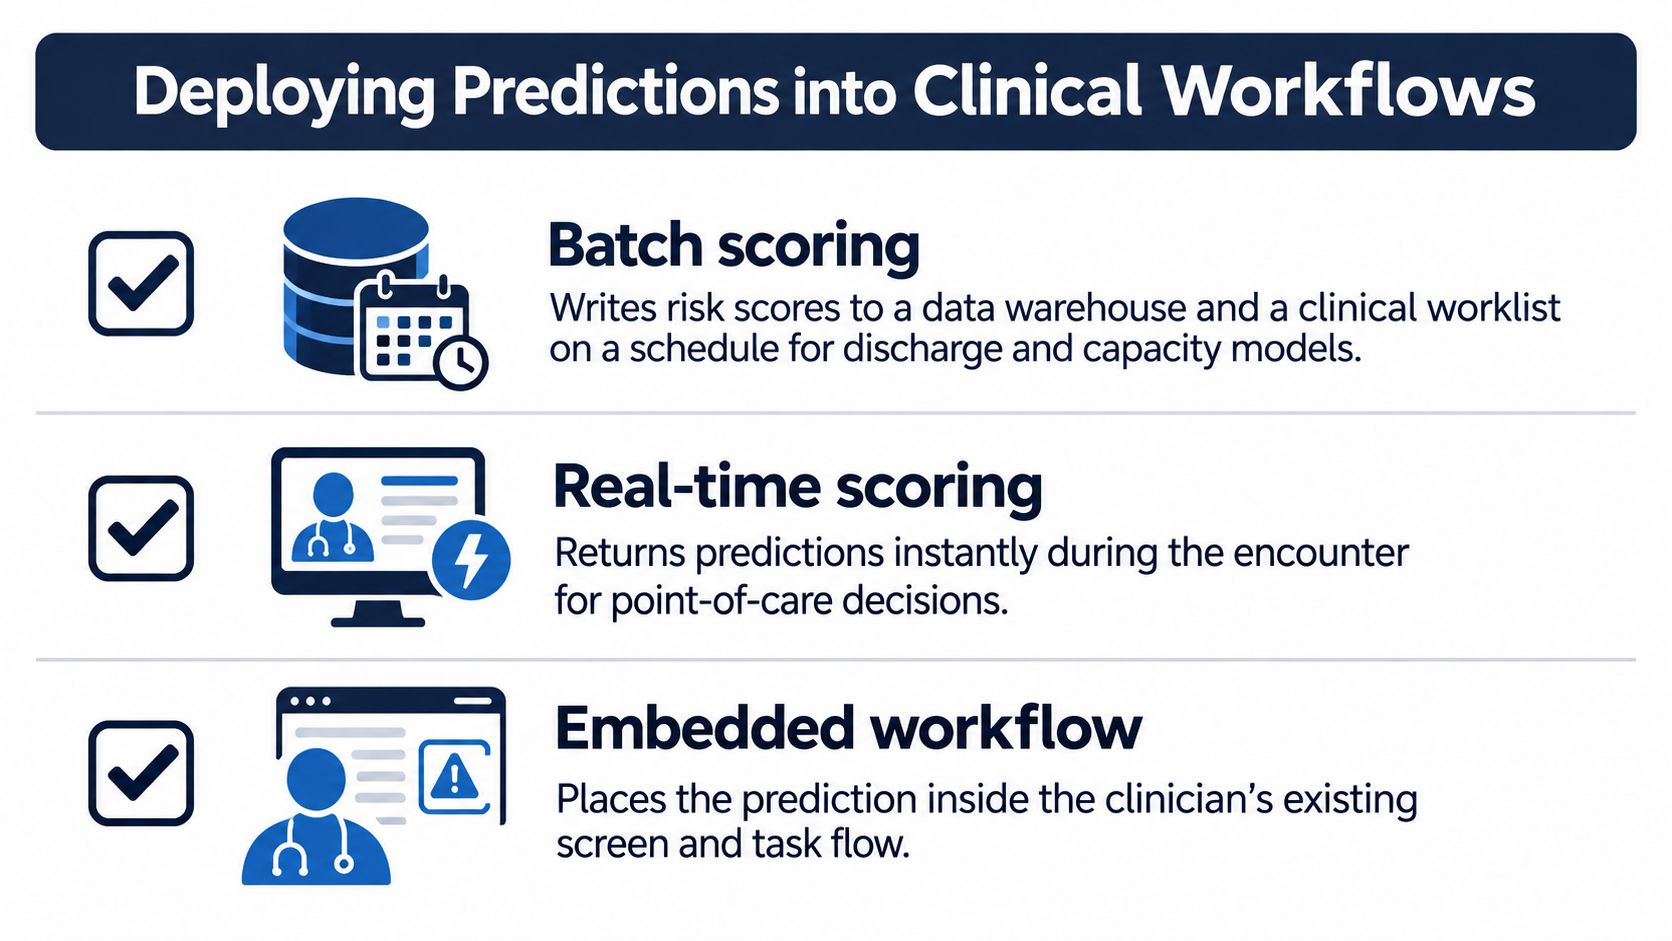
Three integration patterns
Batch scoring writes risk scores to a warehouse and a clinical worklist on a schedule. It suits readmission and capacity models, where a few hours of staleness costs nothing. Real-time scoring is called from the EHR through a FHIR-based decision support interface, and it's the only workable option for deterioration alerts. Embedded scoring runs inside a clinical application with its own interface, giving you more control over presentation and handling you more maintenance.
ONC's Clinical Quality Framework Ruler shows the standards-based version of the middle pattern. It's described as a collection of plugins for the HAPI FHIR Java Persistence API server that supports processing electronic clinical quality measures, evaluating decision logic, applying clinical rules in real time, and providing actionable recommendations at the point of care. FHIR data feeds reusable knowledge artifacts, and real-time evaluation returns a recommendation inside the clinician's own screen.
The alert design checklist
-
Name the owner and the action. One clinical lead, one action per alert.
-
Set the threshold from response capacity. If the team can review eight patients a shift, a threshold that fires on thirty is noise.
-
Show the risk with its uncertainty. A percentage plus the interval beats a colour band.
-
Suppress repeats. One alert per episode, with a defined reset.
-
Capture override reasons from a fixed list plus free text, because the list is what you can analyse.
-
Log every displayed score with model version and input snapshot.
-
Write the retirement rule before launch, so a stale model can be switched off without a committee meeting.
Alert fatigue is measurable through alerts per clinician per shift, acceptance rate and time to action. Run silent mode first: score live data for a defined period, show the output to nobody, then compare against outcomes. Adoption carries its own risk. In a 2024 study of 187 nurse leaders across nine private hospitals in Cairo, 85.0% identified AI-driven predictive analytics as a significant advantage for enhanced decision-making, published in BMC Nursing in 2025. Nursing leadership enthusiasm is an asset that a badly timed alert will quickly spend .
Our data science and BI teams integrate analytics into an existing stack through custom APIs, cloud solutions, or predictive models built alongside your product team, and our healthcare integrations practice covers the HL7 and FHIR interfaces that carry them. For the decision logic layer itself, see our guide to clinical decision support systems.
Regulatory Lines for SaMD, Decision Support and the EU AI Act
A risk score shown to a clinician and a recommendation sent directly to a patient can use the same model, yet raise different regulatory questions. Classification depends on the product's intended use, including the claims made in its labelling and how its output is used.
The intended-use test in the US
FDA's 2022 final guidance on clinical decision support software describes four criteria under section 520(o)(1)(E) of the FD&C Act. The software must not analyse medical images or signals; it must display, analyse, or use medical information; it must support a recommendation to a health care professional; and that professional must be able to independently review the basis for the recommendation. If a function does not meet the applicable criteria, assess whether it may be regulated as a device. Patient-facing and time-critical outputs need particular scrutiny because a user may not have an opportunity to independently review the basis before acting.
Predictive decision-support functions can use statistical methods, regression or machine learning to generate predictions, classifications, recommendations or analyses from data. The method alone does not determine the regulatory status. Assess the function's intended use, the user, the information presented and the action the product is intended to support.
Europe, the UK and Canada
In the EU, medical device software is subject to the MDR (Regulation (EU) 2017/745) and its classification rules. The EU AI Act (Regulation (EU) 2024/1689) adds obligations for high-risk AI systems, including certain systems that are safety components of MDR-regulated devices. Application dates depend on the relevant requirements, so confirm the current timeline with counsel before setting a release plan. The MHRA regulates medical devices in the UK, while Health Canada's software guidance applies in Canada.
Privacy obligations are separate from device classification. HIPAA applies to covered entities and business associates; vendors handling protected health information may need a business associate agreement and Security Rule safeguards. HIPAA de-identification follows 45 CFR 164.514. GDPR treats health data as special category data under Article 9. For GDPR and HIPAA compliance, Bridge Global conducts gap analyses, implements necessary controls, and provides ongoing monitoring.
The documentation should connect intended use and labelling to the model's role in the clinical decision. Bridge Global's medical device software development guidance covers documentation for medical software products.
Monitoring Drift and the KPIs That Prove Value
A model can retain strong overall accuracy while its predictions become poorly calibrated for the people and workflows it is meant to support. Treat monitoring as part of the decision system: check whether predicted risk matches observed outcomes, whether the resulting actions are appropriate, and whether the model still works across the target population.
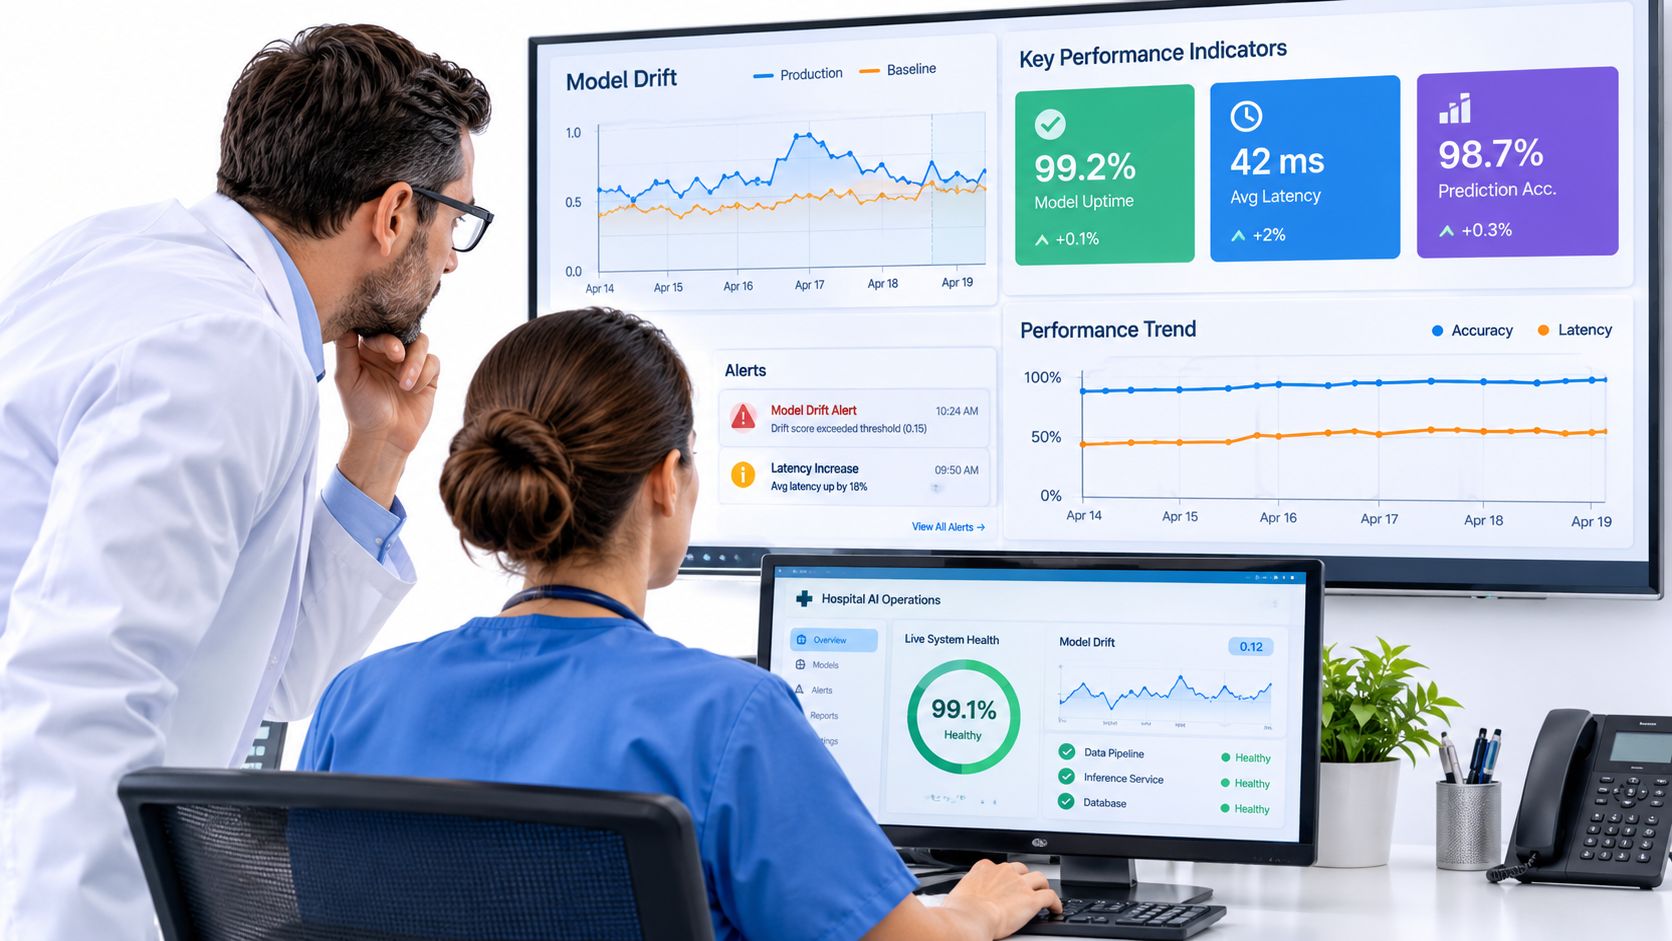
What drifts, and what you do about it
| Drift type | What changes | Signal to monitor | Typical response |
|---|---|---|---|
| Data drift | Input distributions, coding practices or device firmware | Feature distribution tests by site and period | Check the data pipeline, then retrain or pause |
| Concept drift | The relationship between inputs and outcomes, such as after a new treatment protocol | AUROC on a recent labelled cohort | Redevelop or update the model |
| Calibration drift | Predicted risk no longer matches observed event rates | Calibration slope and calibration-in-the-large on recent cohorts | Recalibrate and revisit the decision threshold |
| Label delay | Outcomes are recorded weeks after prediction | Lag between prediction and outcome capture | Use interim metrics and a fixed review cadence |
| Subgroup drift | Performance gaps widen for one population | Subgroup calibration and false-negative rate | Trigger a governance review and check thresholds |
Each signal needs an owner and a response rule. A feature-distribution change may indicate a pipeline or coding change rather than model failure. Conversely, stable inputs do not prove that the relationship between features and outcomes still holds. Label delays also constrain what teams can assess in real time, so interim measures should not be mistaken for confirmed clinical outcomes.
Three KPI layers
Model health includes AUROC on a recent labelled cohort, calibration slope, calibration-in-the-large and subgroup gaps. Workflow measures alerts per clinician per shift, acceptance rate, and time to action. Outcomes can include readmission rate or length of stay among flagged patients compared with a matched group, provided the evaluation design was set before launch.
ROI should use the same defined comparison: estimate net cost per prevented event after intervention and maintenance costs, and state the assumptions. Equity belongs in the review as well. Check which patients are missing from the data, misclassified at the chosen threshold, or unable to act on an alert. Overall accuracy can conceal weaker performance for groups with limited representation in historical records.
Set rollback rules before deployment. Specify acceptable calibration tolerance, a subgroup gap limit and an alert-volume ceiling. Assign a monitoring owner, establish the review cadence, and give that owner authority to switch the model off.
Pilot-to-Production Roadmap and Your First Decision
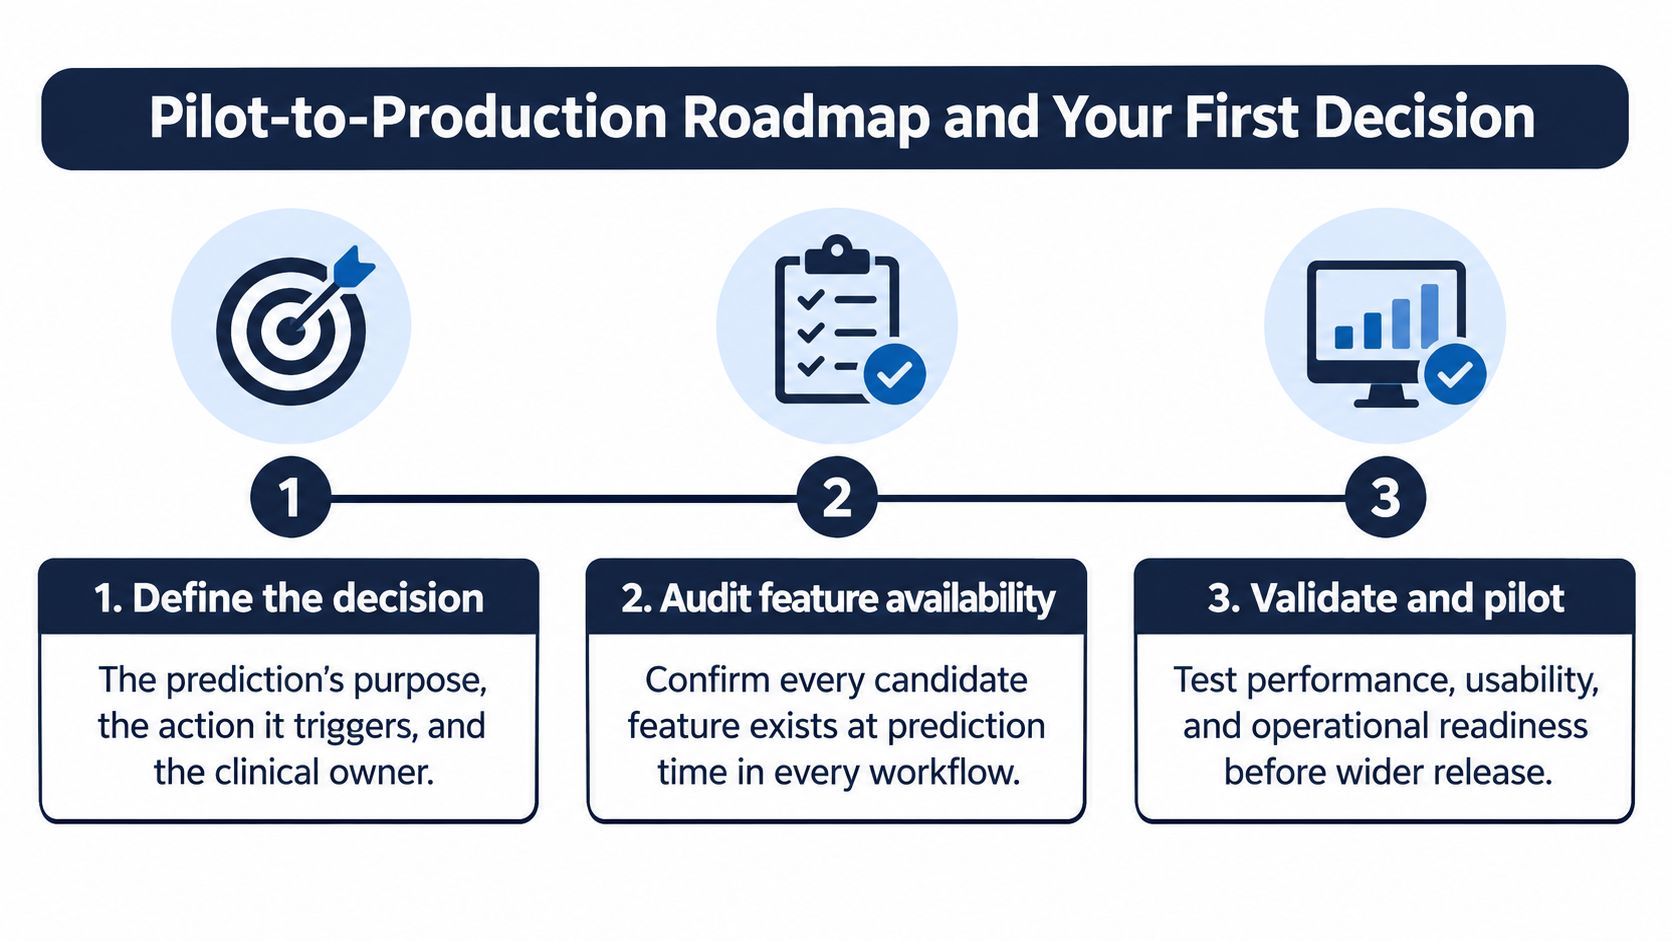
The sequence below is the one I’d run. Each step produces an artifact the next step depends on.
-
Define the decision: Name the action, the clinical owner, and the population. If the action doesn’t exist in the workflow today, the model has nothing to improve.
-
Audit feature availability: Confirm every candidate feature exists at prediction time in every site, checked against the schema rather than the data dictionary.
-
Build a retrospective baseline: A regularised logistic regression benchmarked against a prevalence-only model gives you a floor worth beating.
-
Validate temporally and externally: Add subgroup review and a documented threshold to the same report.
-
Run silent mode on live data: Score for a defined period, show nothing to anyone, compare against outcomes.
-
Launch on one unit or one site: Rollback criteria agreed in advance, in writing.
-
Operate with a named owner: Monitoring, drift review and governance sign-off on a fixed cadence.
The stack around that process is ordinary engineering: a versioned feature pipeline, FHIR or OMOP storage, a model registry such as MLflow, CI tests for data schema and model code, and dashboards cut by site and subgroup. None of it is exotic, and all of it is skippable under deadline pressure, which is why rollback rules belong in the same ticket as the first deployment. For the platform view of the same problem, see our guide to healthcare predictive intelligence.
The first decision is narrow. Does the use case have a defined action, an owner, and data available at prediction time? If the answer is yes, the project has a shape, and the rest is engineering discipline. Bridge Global, a Dutch software engineering partner with a healthtech practice, starts with a consultation that maps your business objectives and challenges to a delivery plan, and can build a healthtech product from scratch or plug into an existing roadmap. The details are on our healthcare page.
Frequently Asked Questions
How much historical data does a readmission model need?
There’s no fixed row count. Sample size depends on the number of outcome events and the number of candidate predictors, so justify it with published methods such as Riley and colleagues’ criteria for prediction model sample size and report the calculation alongside the model.
Does every predictive tool need FDA clearance?
No. Classification follows intended use, and the four criteria in FDA’s clinical decision support guidance decide whether a function is a device. A tool that supports a clinician’s recommendation, where that clinician can review the basis, often sits outside device regulation, while a patient-facing instruction usually doesn’t.
Is HIPAA compliance enough for EU deployments?
No. GDPR special category rules govern health data under Article 9, MDR classification covers medical device software, and the EU AI Act adds obligations for high-risk systems. Build the compliance matrix per market before the architecture hardens.
How should we measure ROI for a prediction model?
Compare net cost per prevented event against a matched comparison group, including intervention and maintenance costs, and state every assumption. Label the result as an indicative estimate rather than a validated return.
Do predictive models have to be explainable?
Clinicians need a rationale they can act on, and in the US the ability to independently review the basis of a recommendation is one of the decision support criteria. Explanations describe model behaviour rather than disease mechanism, and explanation quality needs validating like any other output.
Bridge Global builds regulated healthcare software with MDR, FDA, HIPAA, and ISO requirements designed in from the start, and our teams work inside existing EHR and FHIR systems rather than around them. If you’re moving a clinical prediction model from notebook to production, we can scope the validation, integration, and monitoring work with you. Visit Bridge Global to start that conversation.

About Preethi Saro Philip
Preethi Saro Philip is a Post Graduate Research Degree holder in Economics with more than 10 years of experience in writing, editing, research and teaching. She has an intense passion for content crafting and calls herself a ‘wordsmith’. She enjoys writing on wide-ranging topics including business, technology, health & lifestyle, education, environment etc.
View all posts by Preethi Saro Philip →